Table of Contents[Hide][Show]
Cheese is definitely a staple of the American diet. In fact, on average Americans consume over 40 pounds of cheese per year! While this dairy product hasn’t always had the best reputation as far as healthy foods go, this is in large part based on how it is consumed. Americans put cheese on everything, but it is synonymous with cheese burgers, grilled cheese sandwiches, macaroni and cheese, nachos and above all – pizza. While these may not be the most healthful combinations, independently cheese can provide a lot of “grate” nutrition!
It is assumed that cheese was an accidental discovery resulting from storing milk in a container made from an animal stomach, causing it to turn into curds and whey.
Cheese is a dairy product typically produced from the milk of cows, goats, or sheep, but can be made from the milk of other mammals including buffalo, camel, llama, reindeer, and yak! It has been a part of the human diet since before recorded history (potentially as early as 8000 BCE), with some of the world’s oldest preserved cheeses discovered in Egypt and China from 3200-3600 years ago – talk about well-aged! Although it isn’t known exactly when or where this food originated, it is assumed that cheese was an accidental discovery resulting from storing milk in a container made from an animal stomach, causing it to turn into curds and whey. A fitting hypothesis given how cheese is produced.
Essentially cheese forms from curdling of the milk protein casein. Cheese production begins with the separation of milk into solids (curds) and liquids (whey), which occurs through the acidification of milk via the addition of an acid such as vinegar or more commonly with the introduction of a starter bacteria, which converts the sugar in milk (lactose) into lactic acid. Traditionally this step is followed by the addition of rennet, which is a group of enzymes (primarily chymosin) found in the stomachs of ruminant mammals such as cattle, sheep, and goats (thus explaining the accidental discovery of this ancient food!). Today, however, most cheese is made with chymosin prepared from bacteria – its function being to curdle the casein in milk. After the curds and whey have been separated (and before Little Miss Muffet arrives) the curds may be further processed. For some cheeses the curds are cut into smaller pieces to expel liquid – the extent depends on the type of cheese being produced (harder cheeses are drier), while others are heated, stretched, or washed before salting for flavor and preservation. Finally, the cheese is shaped and aged under controlled temperature and humidity anywhere from a few days to several years! World-wide there are over 1,000 types of cheese each with its own unique flavor, texture, aroma, and appearance, resulting from a multitude of factors including the type of milk used, pasteurization, fat content, processing, flavoring additives, country of origin, and aging to name a few. Surprised there are so many different types of cheese? You “cheddar” believe it!
One type of bacteria found in blue cheese, Brevibacterium linens, is also responsible for foot and body odor!
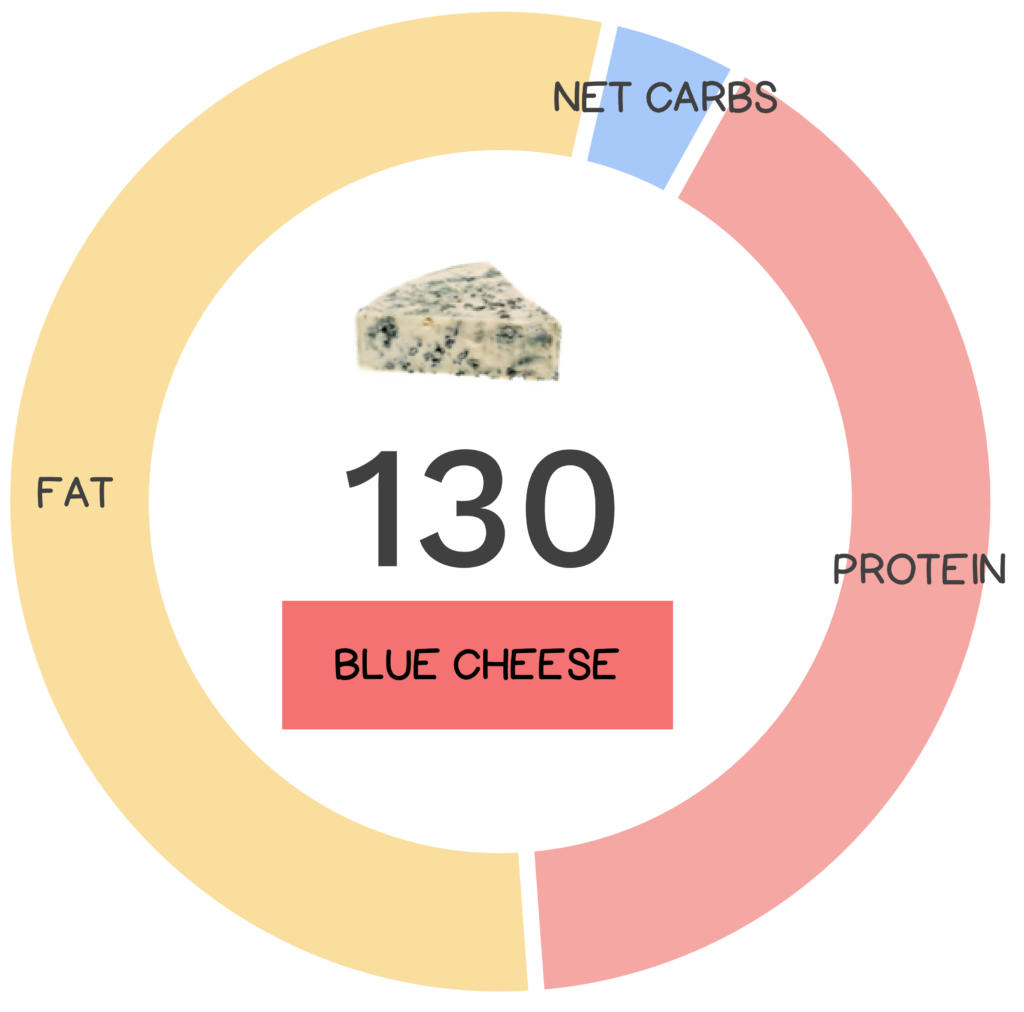
Blue cheese is a generic term referring to several varieties of cheese characterized by blue, black, green, or grey veins or spots of mold. It can be prepared from pasteurized cow’s, goat’s, or sheep’s milk, and is ripened with cultures of penicillium mold. During production, an inoculum of Penicillium roqueforti is introduced into the cheese, and then it is left to age in a temperature-controlled environment for 2 to 3 months. At the beginning of this period the cheese is “spiked” with stainless steel rods allowing oxygen to circulate through air tunnels in order to promote the growth of mold along this interface. In addition to its characteristic color, blue cheese is also famous for its pungent smell. In fact, one type of bacteria found in blue cheese, Brevibacterium linens, is also responsible for foot and body odor!! Legend has it that blue cheese was accidentally discovered after a half-eaten loaf of bread was left behind by a cheesemaker in a cave where cheese was being stored, whereupon the mold covering the bread transformed it into blue cheese. (Talk about “gouda” luck!) Today, popular varieties include Danish Danablu, Italian Gorgonzola, French Roquefort, and British Stilton.
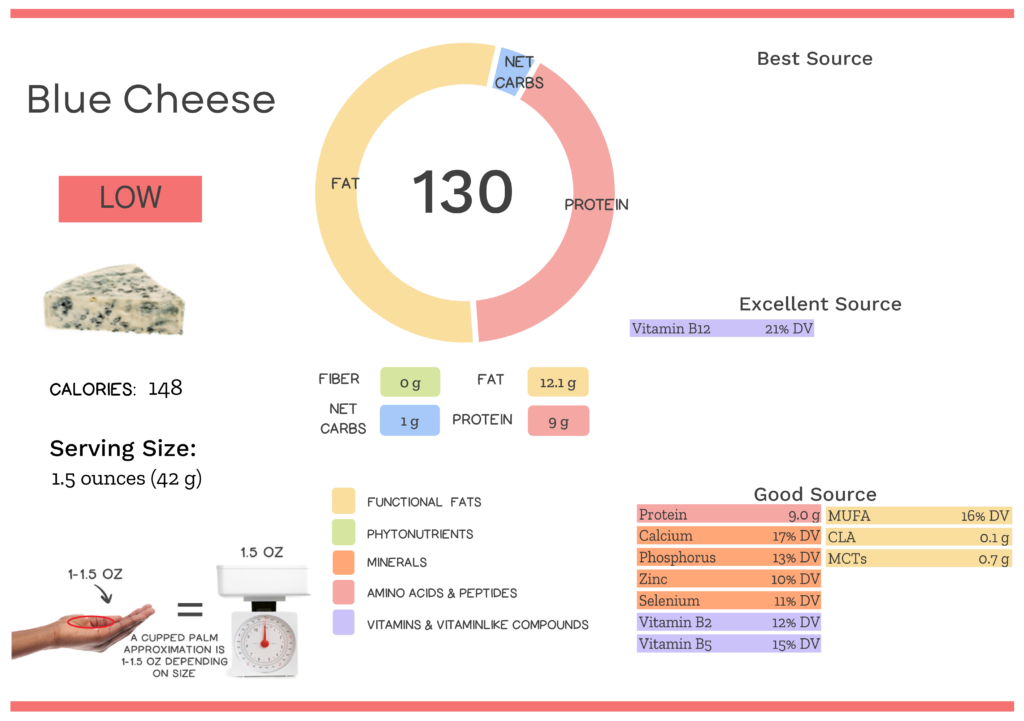
Nutrivore Score for Blue Cheese – 130
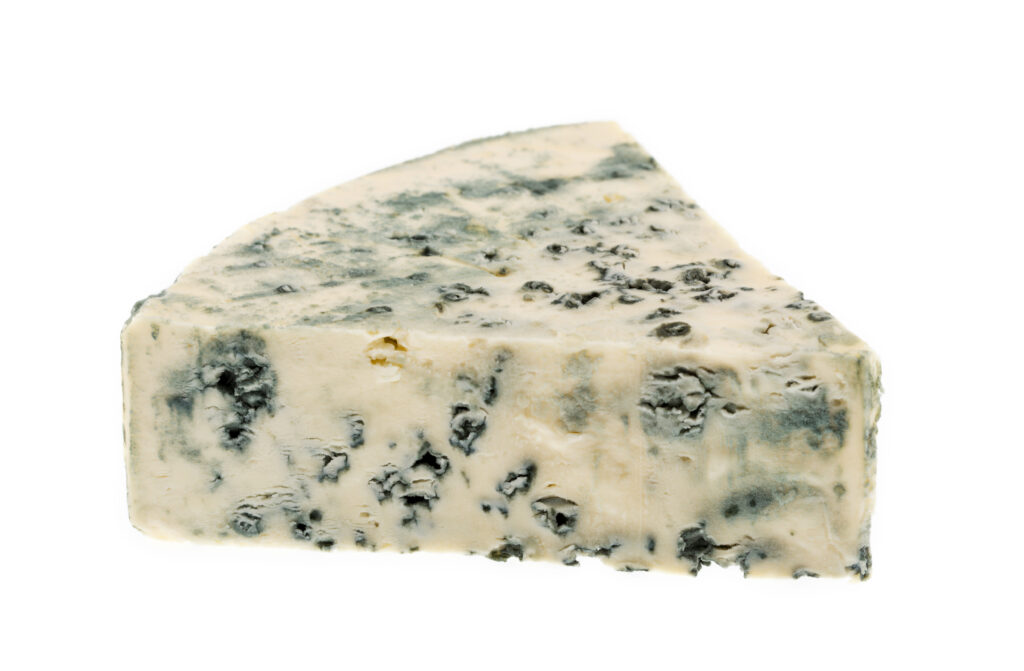
Blue cheese has a Nutrivore Score of 130, making it a low nutrient-dense food! Plus, it is a low-carb food; blue cheese has 1.0 grams of net carbs per 1.5 ounce serving!
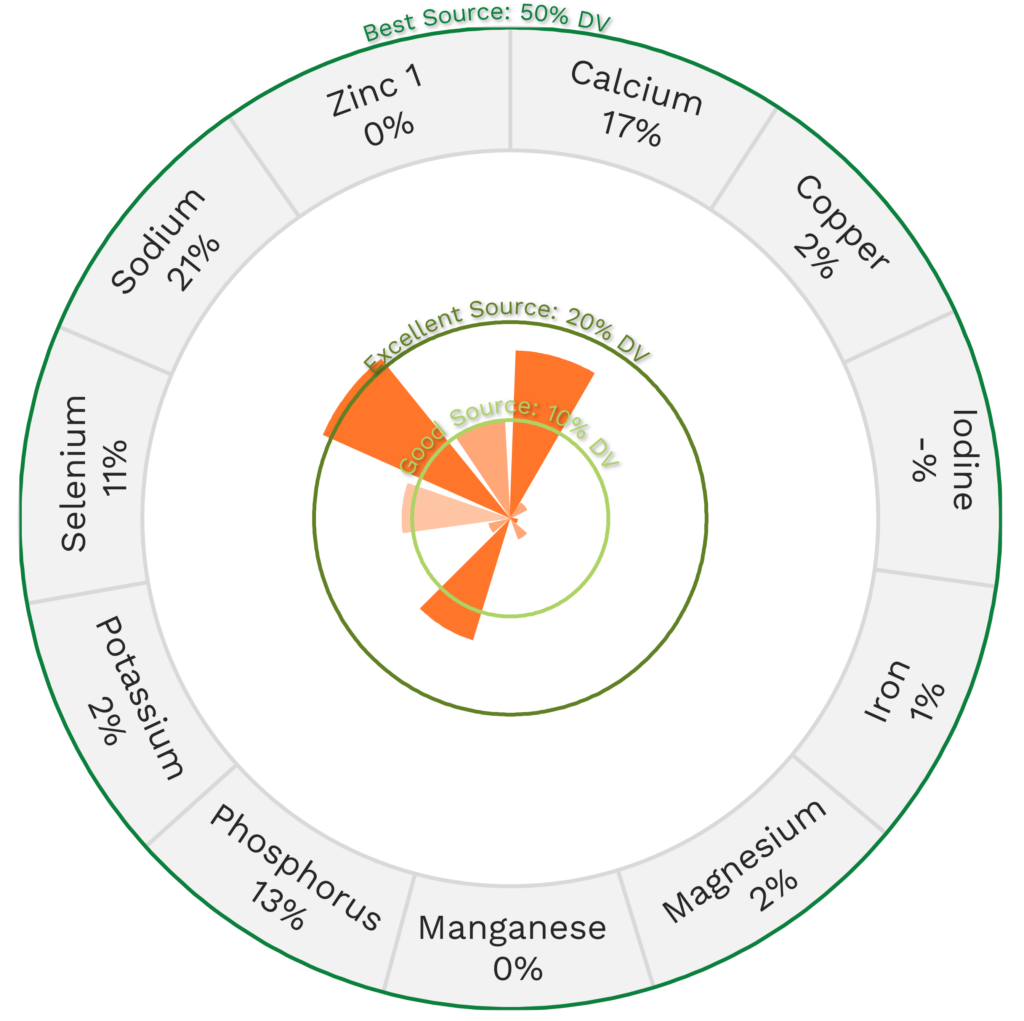
Per serving, blue cheese is an excellent source (20-50% daily value) of vitamin B12 (cobalamin); and a good source (10-20% daily value) of calcium, conjugated linoleic acid (CLA), medium chain triglycerides (MCTs), monounsaturated fatty acids (MUFA), phosphorus, protein, selenium, vitamin B2 (riboflavin), vitamin B5 (pantothenic acid), and zinc.
Ditch Diets. Embrace Nutrients. Start with this FREE Guide.
Sign up for the free Nutrivore Newsletter, your weekly, science-backed guide to improving health through nutrient-rich foods — without dieting harder —and get the Beginner’s Guide to Nutrivore delivered straight to your inbox!

Blue Cheese Nutrition Facts
One serving of blue cheese is standardized to 1.5 ounces or about 42 grams. For reference, 1 cup of blue cheese, crumbled, not packed, weighs 135 grams which means: one serving of blue cheese is roughly equivalent to a little less than 1/3 cup of crumbled blue cheese.
Blue Cheese Nutrition Facts Per Serving
| Blue Cheese | Nutrivore Score: 130 | Nutrient Density: Low |
|---|---|---|
| Serving Size: 1.5 ounces (42 grams) | Protein: 9.0 grams | Net Carbohydrates: 1.0 grams |
| Calories: 148 | Total Fat: 12.1 grams | Dietary Fiber: 0.0 grams |
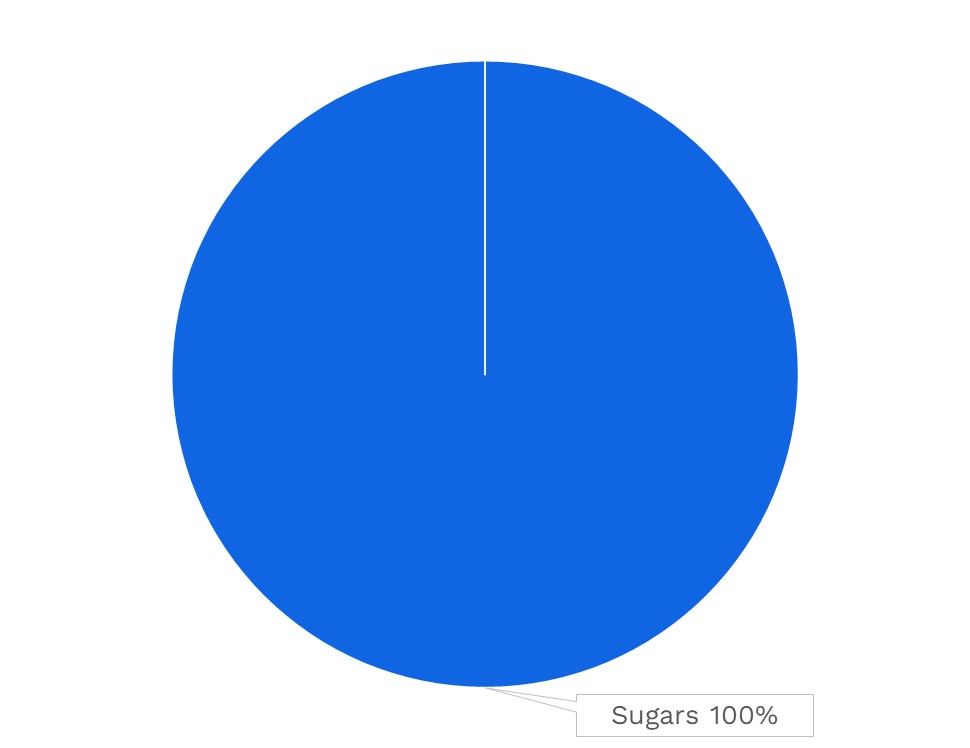
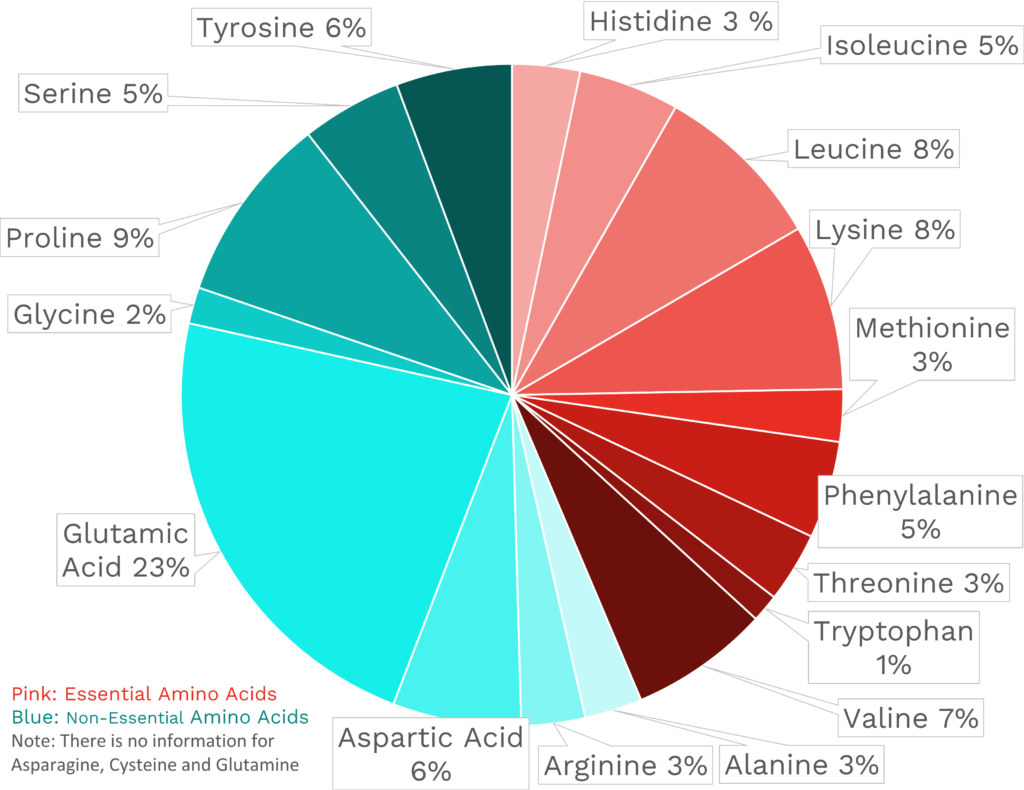
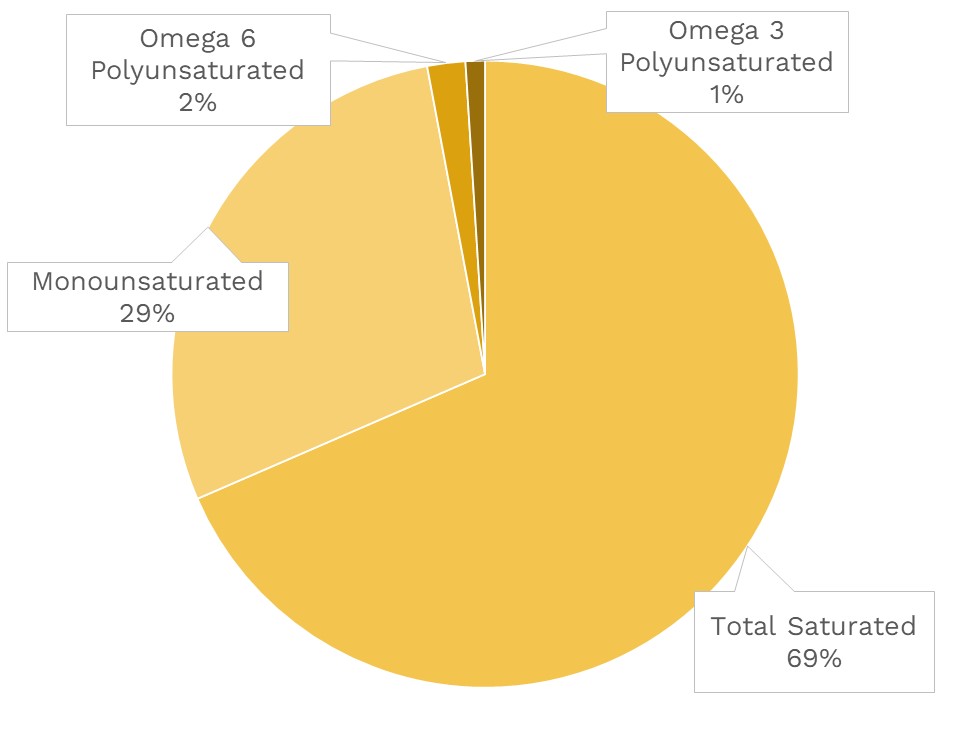
| VITAMINS | ||
|---|---|---|
| Vitamin A | 83.2 μg RAE | 9% DV |
| Vitamin B1 (Thiamin) | 12.2 μg | 1% DV |
| Vitamin B2 (Riboflavin) | 160.4 μg | 12% DV |
| Vitamin B3 (Niacin) | 0.4 mg | 3% DV |
| Vitamin B5 (Pantothenic Acid) | 0.7 mg | 15% DV |
| Vitamin B6 (Pyridoxine) | 69.7 μg | 4% DV |
| Vitamin B7 (Biotin) | 1.3 μg | 4% DV |
| Vitamin B9 (Folate) | 15.1 μg | 4% DV |
| Vitamin B12 (Cobalamin) | 0.5 μg | 21% DV |
| Vitamin C | 0.0 mg | 0% DV |
| Vitamin D (D2 + D3) | 0.2 μg | 1% DV |
| Vitamin E | 0.1 mg | 1% DV |
| Vitamin K | 1.0 μg | 1% DV |
| Choline | 6.5 mg | 1% DV |
| Myo-Inositol | 2.3 mg | ~ |
| CoQ10 | 0.1 mg | ~ |
| FUNCTIONAL FATS | ||
|---|---|---|
| MUFA | 3.3 g | 16% DV |
| ALA | 110.9 mg | 7% DV |
| EPA + DHA | 0.0 mg | 0% DV |
| CLA | 96.1 mg | ~ |
| Linoleic Acid | 0.2 g | 1% DV |
| MCT’s | 0.7 g | ~ |
| MINERALS | ||
|---|---|---|
| Calcium | 221.8 mg | 17% DV |
| Copper | 16.8 μg | 2% DV |
| Iodine | ~ | ~ |
| Iron | 0.1 mg | 1% DV |
| Magnesium | 9.7 mg | 2% DV |
| Manganese | 3.8 μg | 0% DV |
| Phosphorus | 162.5 mg | 13% DV |
| Potassium | 107.5 mg | 2% DV |
| Selenium | 6.1 μg | 11% DV |
| Sodium | 481.3 mg | 21% DV |
| Zinc | 1.1 mg | 10% DV |
| PHYTONUTRIENTS | ||
|---|---|---|
| Carotenoids | 31.1 μg | ~ |
| Polyphenols | 0.0 mg | ~ |
| Phytosterols | 0.0 mg | ~ |
| Glucosinolates | ~ | ~ |
| Thiosulfinates | ~ | ~ |
| Betalains | ~ | ~ |
| AMINO ACIDS & PEPTIDES | ||
|---|---|---|
| Taurine | ~ | ~ |
| Ergothioneine | ~ | ~ |

Blue Cheese Nutrition Varies With Type
Blue cheese is a generic term referring to several varieties of cheese prepared from different types of milk. Popular varieties include Danablu, Gorgonzola, and Stilton, all prepared from cow’s milk, while Roquefort is prepared from sheep’s milk. Not only do different varieties of blue cheese look, smell, and taste differently, they also have differing nutrient profiles, which means their Nutrivore Scores also vary.
| NUTRIVORE SCORE | |
|---|---|
| Blue cheese | 130 |
| Roquefort cheese | 1461 |
Cheese Nutrition Varies With Type
There are over 1,000 types of cheese, each with its own unique flavor and nutrient profile, which means their Nutrivore Scores vary too! In general, dairy products, especially cheeses, have the lowest nutrient density among animal foods while also having the highest caloric density. The table below provides a sampling (a cheese board if you will) of Nutrivore Scores for differing types of cheese, all of which are similar in nutrient density.
| NUTRIVORE SCORE | |
|---|---|
| Blue cheese | 130 |
| Brie cheese | 130 |
| Cheddar cheese | 126 |
| Cottage cheese, low-fat, 2% | 201 |
| Cream cheese | 78 |
| Feta cheese | 189 |
| Goat cheese, soft | 149 |
| Gouda cheese | 136 |
| Mozzarella cheese, whole milk | 145 |
| Parmesan cheese, hard | 138 |
| Swiss cheese | 157 |
Impressed by all the “grate” nutrition in blue cheese? Maybe your friends will be too!
Health Benefits of Blue Cheese Nutrients
Let’s take a closer look at all of the best and excellent source of nutrients found in a 1.5-ounce serving of blue cheese and see how they benefit our health.
Blue Cheese Provides 21% DV Vitamin B12 (Cobalamin)
Blue cheese is an excellent source of vitamin B12 (cobalamin), providing 21% of the daily value per 1.5-ounce serving!
Vitamin B12 (cobalamin) is a water-soluble vitamin that serves as a cofactor for enzymes involved in energy metabolism, red blood cell production, DNA synthesis, neurotransmitter production, nervous system health, and folate metabolism. As a result of these roles, vitamin B12 is vital for maintaining brain and nervous system health, and may have a protective effect against dementia, Alzheimer’s disease, and depression. There’s also some evidence vitamin B12 may be cancer-protective, possibly through supporting folate metabolism (which then assists in repairing DNA damage). Learn more about vitamin B12 here.
Learn What Foods Are the Best Sources of Every Nutrient
The Top 25 Foods for Every Nutrient
The Top 25 Foods for Every Nutrient e-book is a well-organized, easy-to-use, grocery store-friendly guide to help you choose foods that fit your needs of 43 important nutrients while creating a balanced nutrient-dense diet.
Get two “Top 25” food lists for each nutrient, plus you’ll find RDA charts for everyone, informative visuals, fun facts, serving sizes and the 58 foods that are Nutrient Super Stars!
Buy now for instant digital access.
How Much Blue Cheese Should We Eat Per Day?
While dairy products may not be the most nutrient-dense foods, they are a “grate” source of calcium in addition to containing a range of other nutrients, all the while being a complete protein – “whey” better than you thought, huh?
Studies show a good target for most people is two servings of dairy products daily, with the most benefits coming from fermented versions like yogurt or kefir.
A 2021 meta-analysis of 55 prospective cohort studies found that dairy consumption in general was associated with a 10% lower risk of stroke, a 4% lower risk of coronary heart disease, and a 9% reduced risk of hypertension (high blood pressure). A 2016 meta-analysis of 29 cohort studies showed that cheese reduced cardiovascular disease risk, and fermented dairy reduced total mortality risk, albeit by a very modest amount (2% per 20 gram serving of fermented dairy or 10 gram serving of cheese). Importantly, a 2017 meta-analysis revealed a U-shaped dose response curve for dairy products, with intake up to about 400 grams daily modestly reducing all-cause mortality (again, only about a 2% effect), but higher consumption levels no longer being beneficial—intake greater than 1000 grams per day was associated with a 15% increased risk of total mortality.
A serving of milk or yogurt is 1 cup (8 ounces, or 250mL) and a serving of cheese is 1.5 ounces (about 42 grams). Learn more about dairy products here.
Easily track your servings of Nutrivore Foundational Foods!
The Nutrivore Weekly Serving Matrix
The Nutrivore Weekly Serving Matrix digital resource is an easy-to-use and flexible weekly checklist designed to help you maximize nutrient-density and meet serving suggestions of Nutrivore foundational foods, all without having to weigh or measure your foods!
Includes a 22-page instructional guide and downloadable interactive guides.
Buy now for instant digital access.
cITATIONS
Expand to see all scientific references for this article.
Clements RS Jr, Darnell B. Myo-inositol content of common foods: development of a high-myo-inositol diet. Am J Clin Nutr. 1980 Sep;33(9):1954-67. doi: 10.1093/ajcn/33.9.1954. PMID: 7416064.
Kumar S, Sharma B, Bhadwal P, Sharma P, Agnihotri N. “Lipids as Nutraceuticals: A Shift in Paradigm.” In Therapeutic Foods: Handbook of Food Bioengineering, edited by AM Holban, AM Grumezescu, 51-98. Academic Press, 2018.
Pravst I, Zmitek K, Zmitek J. Coenzyme Q10 contents in foods and fortification strategies. Crit Rev Food Sci Nutr. 2010 Apr;50(4):269-80. doi: 10.1080/10408390902773037. PMID: 20301015.
USDA Food Central Database: Cheese, blue
Watanabe T, Kioka M, Fukushima A, Morimoto M, Sawamura H. Biotin content table of select foods and biotin intake in Japanese. Int J Anal Bio-Sci. 2014. Vol 2(4):109-125.
